Almost every website gets its speed checked at some point, usually at go-live, sometimes when someone complains about long load times. What happens between those two moments, nobody usually sees. Yet PageSpeed scores rarely collapse with a loud bang; they slip gradually: a plugin update here, an uncompressed image there, a tracking script a colleague added “just for a moment”.
In this post we compare five ways to keep an eye on PageSpeed and Core Web Vitals, from manual testing to fully automatic monitoring. Including an honest assessment of when each approach is the right one.
One question runs through all five, and it decides more than the feature list does: is only the one address someone entered being checked, or the whole website?
What to expect in this article
- Approach 1: PageSpeed Insights — the manual classic
- Approach 2: Google Search Console — field data with a delay
- Approach 3: Lighthouse CI — monitoring for development teams
- Approach 4: Commercial monitoring services
- Approach 5: SiteSentry — monitoring the whole website automatically
- The head-to-head comparison
- Conclusion: which approach for whom?
Approach 1: PageSpeed Insights — the manual classic
PageSpeed Insights is the best-known entry point: enter a URL, wait a few seconds, read the score. The tool delivers lab data from a fresh Lighthouse run plus (provided there’s enough traffic) real user data from the Chrome User Experience Report. On top come concrete improvement suggestions, sorted by estimated impact.
For diagnosis, that’s superb. As monitoring, it fails for one simple reason: it only measures when someone remembers to. In practice, after the initial optimisation, nobody measures for months, and it’s exactly during that time that regressions creep in. Add to that the fact that almost always only the homepage gets tested, while the subpages that actually generate revenue go unwatched.
Suited to: spot diagnosis and before-and-after comparisons during optimisation work. Not suited as a permanent solution.
Approach 2: Google Search Console — field data with a delay
Under “Core Web Vitals”, Search Console shows how real visitors experience your pages, aggregated across the whole domain and grouped into good URLs, URLs needing improvement and poor URLs. This is field data: exactly the values that flow into rankings. Free and with no setup, provided the property is already verified.

The catch is the sluggishness: the data is based on a rolling 28-day window. If a page degrades today, it takes weeks before that shows up in Search Console, and more time before anyone notices, because Search Console practically never speaks up on its own about Core Web Vitals regressions. As an early-warning system it’s out; as a monthly reality check it remains mandatory.
Suited to: the regular look at real user data and the ranking perspective. Too slow for root-cause hunting.
Approach 3: Lighthouse CI — monitoring for development teams
If you run your own build pipeline, you can integrate Lighthouse CI: a Lighthouse test runs automatically on every deployment, and if defined budgets are breached, the build fails. Performance regressions are caught before they even go live. Conceptually, this is the cleanest approach.
Honestly, though, this isn’t for the majority of website operators: it requires a CI/CD environment, technical setup and someone to look after the results. And it only checks on deployments; the regression caused by a nightly plugin auto-update or an externally hosted script is invisible to Lighthouse CI.
Suited to: teams with their own deployment pipeline, as a complement. No substitute for continuous monitoring of the live site.
Approach 4: Commercial monitoring services
Services such as DebugBear, SpeedVitals or Calibre have turned continuous monitoring into a business model: scheduled measurements from multiple locations, in some cases true real-user monitoring, alerts, dashboards, historical comparisons. Functionally this is the premium class; anyone running an international portal with a performance team will find what they need here.
For small and medium websites, two things stand in the way: ongoing subscription costs, and a feature set of which only a fraction gets used day to day. Most operators don’t need measurements from twelve countries. They simply want to know when their website has become slower.
Suited to: larger projects with a dedicated performance budget and an international audience.
Approach 5: SiteSentry — monitoring the whole website automatically
Because exactly this gap (automatic monitoring without a subscription and without a setup project) kept coming up with our own maintenance clients, we built SiteSentry and provide it free of charge.
The difference that matters most is exactly the question from the start: you monitor a website, not an address. You enter the homepage, SiteSentry crawls the site from there and adds the subpages it finds to the monitoring; how deep the crawl goes and how many pages end up monitored is up to you. That closes the gap from approach 1: the homepage is almost never the slowest page. The outliers sit in product listings, search results, form flows and old posts, which is precisely where nobody measures by hand on a regular basis. If you’d rather be selective, you can still enter individual addresses; both work.
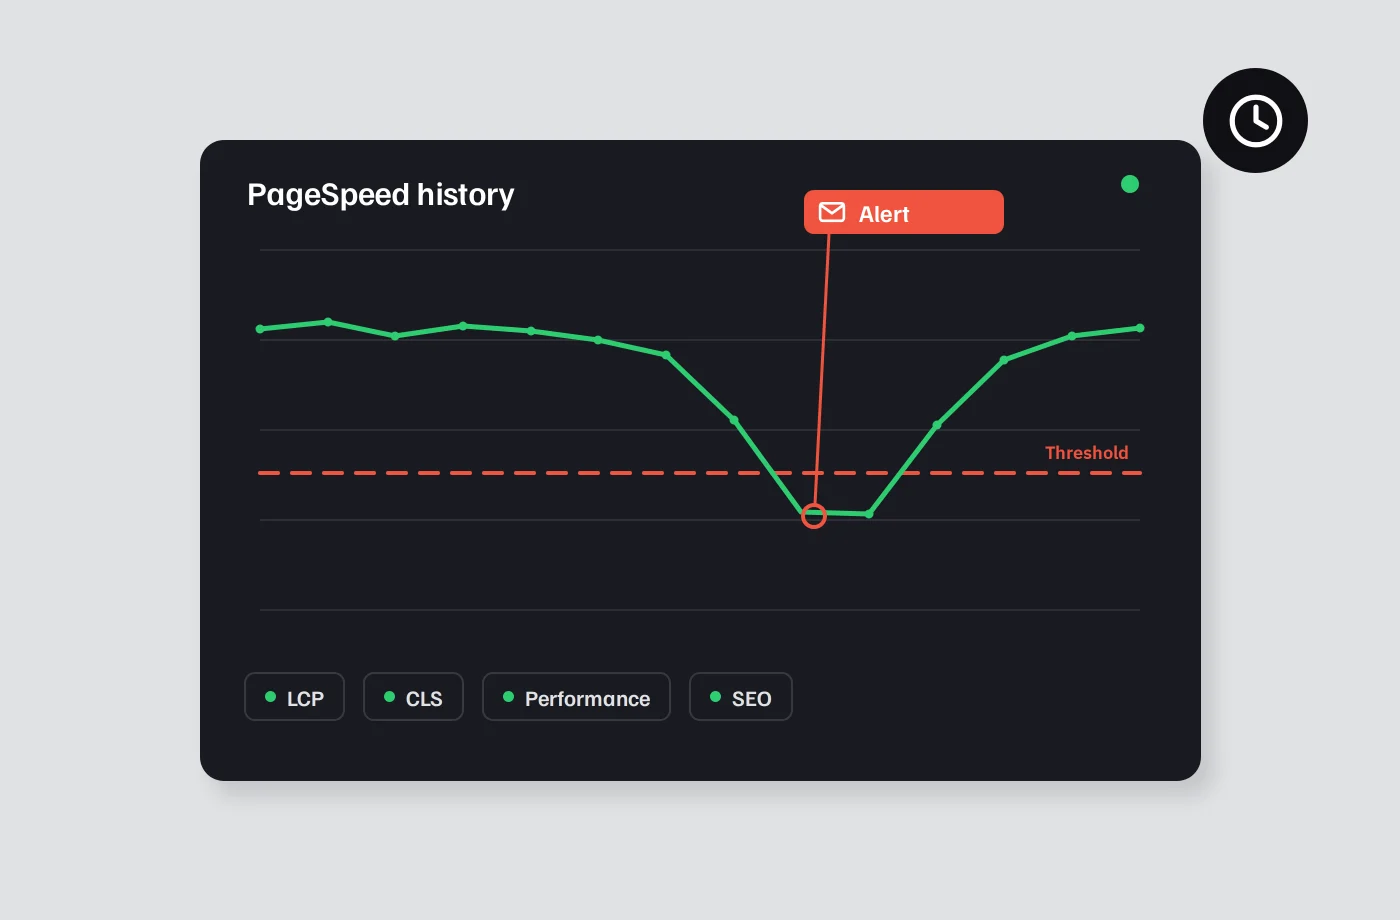
The rest is a matter of settings: a check interval from every two hours to once a day, mobile or desktop, and thresholds per metric. Measurement runs through the official Google PageSpeed API on purpose: the history thus records exactly the values PageSpeed Insights reports, i.e. the four PageSpeed categories as well as Core Web Vitals such as LCP and CLS. If a value falls below the threshold, an email arrives; otherwise your inbox stays quiet. The history shows when a value tipped, which turns root-cause analysis from guessing into narrowing down.
For completeness, the honest assessment here too: SiteSentry automates Google’s official PageSpeed lab measurements. True real-user monitoring, measurements from different countries or request-level waterfall analyses are what the commercial services in approach 4 offer; if you need that, you’re better served there. For the question “Has my website become slower this week, and since when?”, however, it’s entirely sufficient.
Suited to: anyone who wants to keep a permanent eye on their website — the whole of it, not just the homepage — without paying for it or setting anything up.
The head-to-head comparison
| Automatic | Alerts | History | All pages | Cost | |
|---|---|---|---|---|---|
| PageSpeed Insights | ✗ | ✗ | ✗ | manual per URL | free |
| Search Console | ✓ (sluggish) | barely | limited | ✓ | free |
| Lighthouse CI | ✓ (on deploys) | ✓ | ✓ | configurable | free, setup required |
| Commercial services | ✓ | ✓ | ✓ | ✓ | subscription |
| SiteSentry | ✓ | ✓ | ✓ | ✓ (crawls the site) | free |
Conclusion: which approach for whom?
These approaches aren’t mutually exclusive; they complement each other. Our recommendation for most websites: PageSpeed Insights for spot diagnosis, Search Console as the monthly reality check with real user data, and in between an automatic monitor that speaks up before the field data tips. Whether that’s SiteSentry or another tool is ultimately secondary. What matters is that measurement happens continuously at all — and that “the website” means all of it. A homepage that has been green for months says nothing about the checkout.
Why that is and what good monitoring looks like, we’ve summarised on our PageSpeed monitoring page. And if the monitoring reports a regression that doesn’t explain itself: we find and fix the causes as part of our PageSpeed optimisation, or permanently as part of our website maintenance.